Wednesday, October 19, 2016

Concurrent Program with Organizational Chart Output

As described in my previous post, we can use HTML and JavaScript to draw tree diagrams from the output of a Hierarchical SQL. This could also be used for various applications in Oracle eBusiness Suite. One of the uses will be to visualize organizational structure.

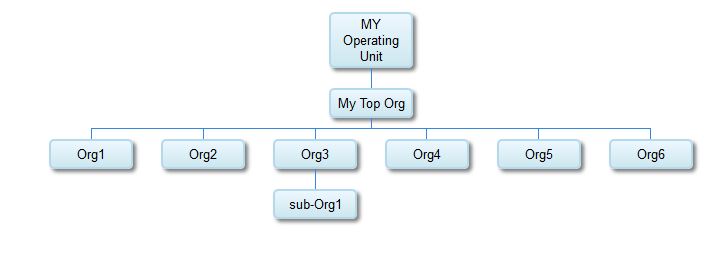
The purpose of the below exercise is to develop a concurrent program which accepts an operating unit as input parameter and draw the Organizational diagram in tree format as shown in the sample below.


Please follow the below steps to define this concurrent program.

Step 1:- Package Specification

Compile the below package specification in APPS schema.


Step 2:- Package Body

Compile the below package body in APPS schema.


Step 3:- Define Concurrent Program Executable

Define the concurrent program executable of PL/SQL type with  execution file name as xx_org_chart_pk.output


 Step 4:- Define Concurrent Program

Define the concurrent program for the executable in previous step. Please make sure that the output format is HTML.


Step 5: Add Operating Unit Parameter

Add one parameter to the program. The selected value for this parameter will be the top node in the diagram.


Now that concurrent program is defined, you can attach it to appropriate responsibilities and submit from Standard Request Submission window.

Foot Notes

  • The client machine requires internet connection to display the diagram. This is since the code accesses JavaScript library source from the corresponding site.
  • The JavaScript library used is from gstatic. Please read the documentation to extend this functionality.
  • The PLSQL program in the demo handles only the basic case for simplicity. Please feel free to extend the code.
  • On double clicking a parent node, it collapses.
  • Some browsers have trouble displaying chart when the number of nodes exceeds the set limit for that browser. I have experienced it with Internet Explorer. Try different browsers if you are getting blank output.

Wednesday, October 12, 2016

Hierarchical SQL with Tree Diagram output

The greatest value of a picture is when it forces us to notice what we never expected to see
                                                                                                              - John Wilder Tukey

Hierarchical SQL output is not easy to read in tabular format. I have seen developers trying to visualize the output in various ways. Provided you have a browser, it is not difficult to generate an output like the below using HTML and JavaScript.

Steps

1. Prepare Hierarchical SQL

I am using the classic EMP table in SCOTT schema.

SELECT e.ename node
,m.ename PARENT
,e.empno || ' ' || e.job tooltip
FROM scott.emp e
,scott.emp mWHERE e.mgr = m.empno(+)
CONNECT BY PRIOR e.empno = e.mgr
START WITH e.job = 'PRESIDENT'

Please make sure that there are 3 columns in your SQL with aliases as below.

  1. Node :- Unique name for the node
  2. Parent :- Name of the parent Node
  3. Tooltip : Tooltip description to be displayed when mouse is moved over the node.

2. Compile the below procedure in database.


Step 3 : Execute the PLSQL procedure

Invoke the above PLSQL procedure with SQL in Step 1 as parameter. The output will be written to DBMS output. Please make sure that the output size is set accordingly.


Step 4 : Save the output as an htm file.

The output will be written with html tags with JavaScript. Save the output with an htm extension.

Step 5: Open the HTM file in web browser

This will display the hierarchical output as a tree diagram assuming the local machine has internet connection. Internet connection is required since the JavaScript tries to access the library on the Google website.

Friday, September 30, 2016

Script to generate documentation for PLSQL package

“Good code is its own best documentation" - - Steve McConnell

In most of the PLSQL documentation I have seen, large percentage of the information is trivial and is of minimal use in understanding the code. However many clients demand detailed level documentation to be provided along with the code delivery. Producing documentation for large PLSQL packages can be a tedious job.

The below method accepts a PLSQL package name (or filter with wild cards) as input parameter and produce an HTML output with the below information for each functions and procedures inside the package.

1. Name of the function/procedure
2. A description of the procedure which is stripped from any comment provided on top of the procedure/function.
3. List of parameters and types.
4. SQL statements used in the procedure/function
5. Dependendent tables and views used by the procedure/function.

Steps to generate the documentation

Step 1 

Download and compile the PLSQL package.xx_plsql_doc

Step 2

Make sure that the dbms_output is on and the buffer size large enough. Invoke the procedure with the package name as the parameter value.

begin
       xx_plsql_doc.generate('FND_USER_PKG');
end;


Alternatively, you can use  a wildcard instead of the package name as parameter.

begin
       xx_plsql_doc.generate('FND_USER%');
end;


Step 3

Save the HTML tags in Output window as a text file with .htm extension

Step 4

Open the .htm file using the browser. The output can be then copied to other applciations such as Microsft Word. The output for each ptocedure will be in the below format.


With this approach, we can produce consistent documentation across the project. I would suggest to edit the generated documentation to add information about any special logic which is used in the code.

Friday, August 12, 2016

Oracle eBusiness Suite: Concurrent Program with Pie Chart output


Oracle provides the option to produce an HTML output for concurrent programs. Using JavaScript in HTML output enables developers to produce graphical output. The possibilities are endless as anything which can be displayed on a web page can be shown as concurrent program output.

The below sample requirement demonstrates this by displaying a Pie chart as the output of the concurrent program.

 Sample Requirement


Develop a concurrent program that will output the number of employees from each country working for the organization as a pie-chart as shown below.

 Steps


1.    Download and compile xx_pie_chart_pk in APPS schema. The PLSQL uses JavaScript as demonstrated in Google Developers site.

2.    Prepare the SQL to retrieve required data. The SQL is expected to have 2 fields in the SELECT clause with first one as the field description and then the count.

SELECT territory_short_name
      ,COUNT(*) cnt
FROM   per_addresses      addr
      ,fnd_territories_tl terr
WHERE  addr.country = terr.territory_code
GROUP  BY territory_short_name
HAVING COUNT(*) > 100;

3.    Create PLSQL package specification for the concurrent program as below.


4.    Create PLSQL package body for the concurrent program as below. Please note that 2 parameters are the SQL from previous step and the title to be displayed in the output.


5.    Define Concurrent program executable.


6.Define Concurrent program. Please make sure that the output is set as ‘HTML’.


7. Attach the concurrent program to suitable responsibility.

8. Submit the concurrent request and review the output.

There are a vast number of types of charts and other graphical components which can be added to the HTML output using Javascript.